
Network maps#
GBON network maps#
The primary goal of the mapmetnet.mapper module is to assemble fully-fledged GBON compliance network
maps, as illustrated in the following example:
from mapmetnet.mapper import GBONMapper

che_map = GBONMapper('CHE', mrgid=None)
che_map.generate_map(figid=1,
                     pad_frac=0.025,
                     station_type='surface',
                     var_name='temperature',
                     interval='daily',
                     category='availability',
                     date='2026-04-13',
                     high_density=True,
                     show_influence_area=False,
                     show=True)
(Source code, png, hires.png, pdf)
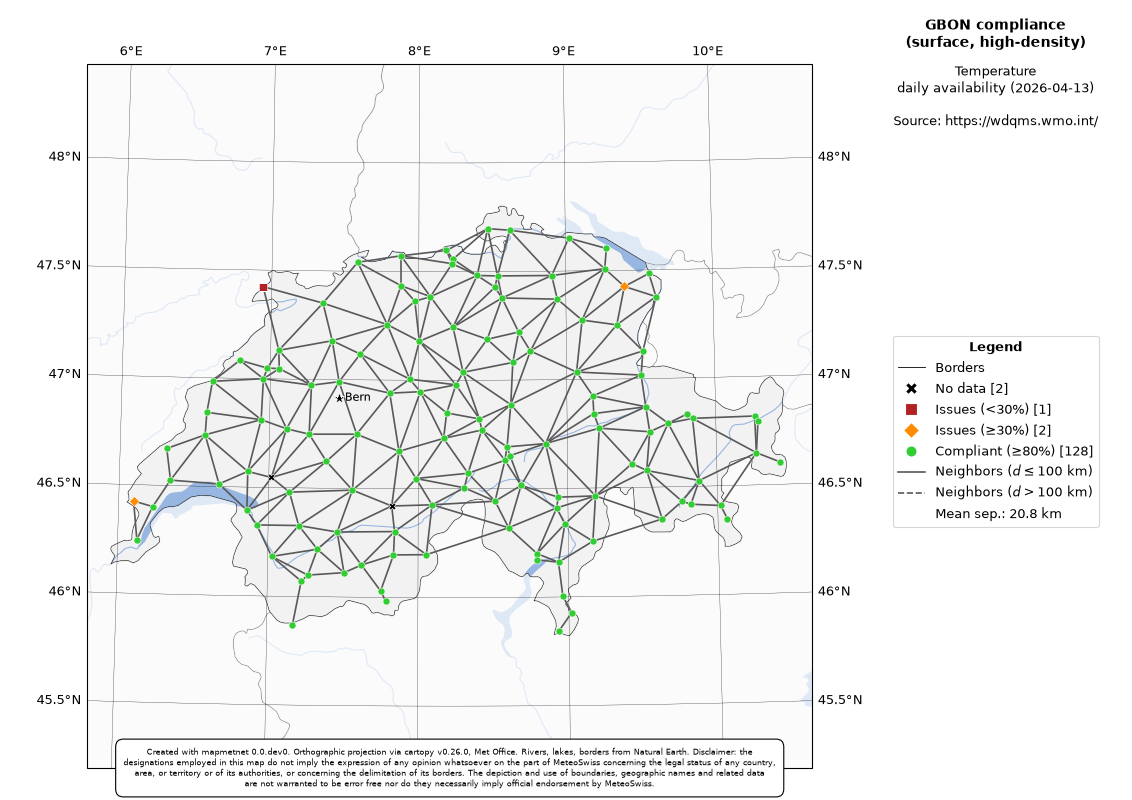
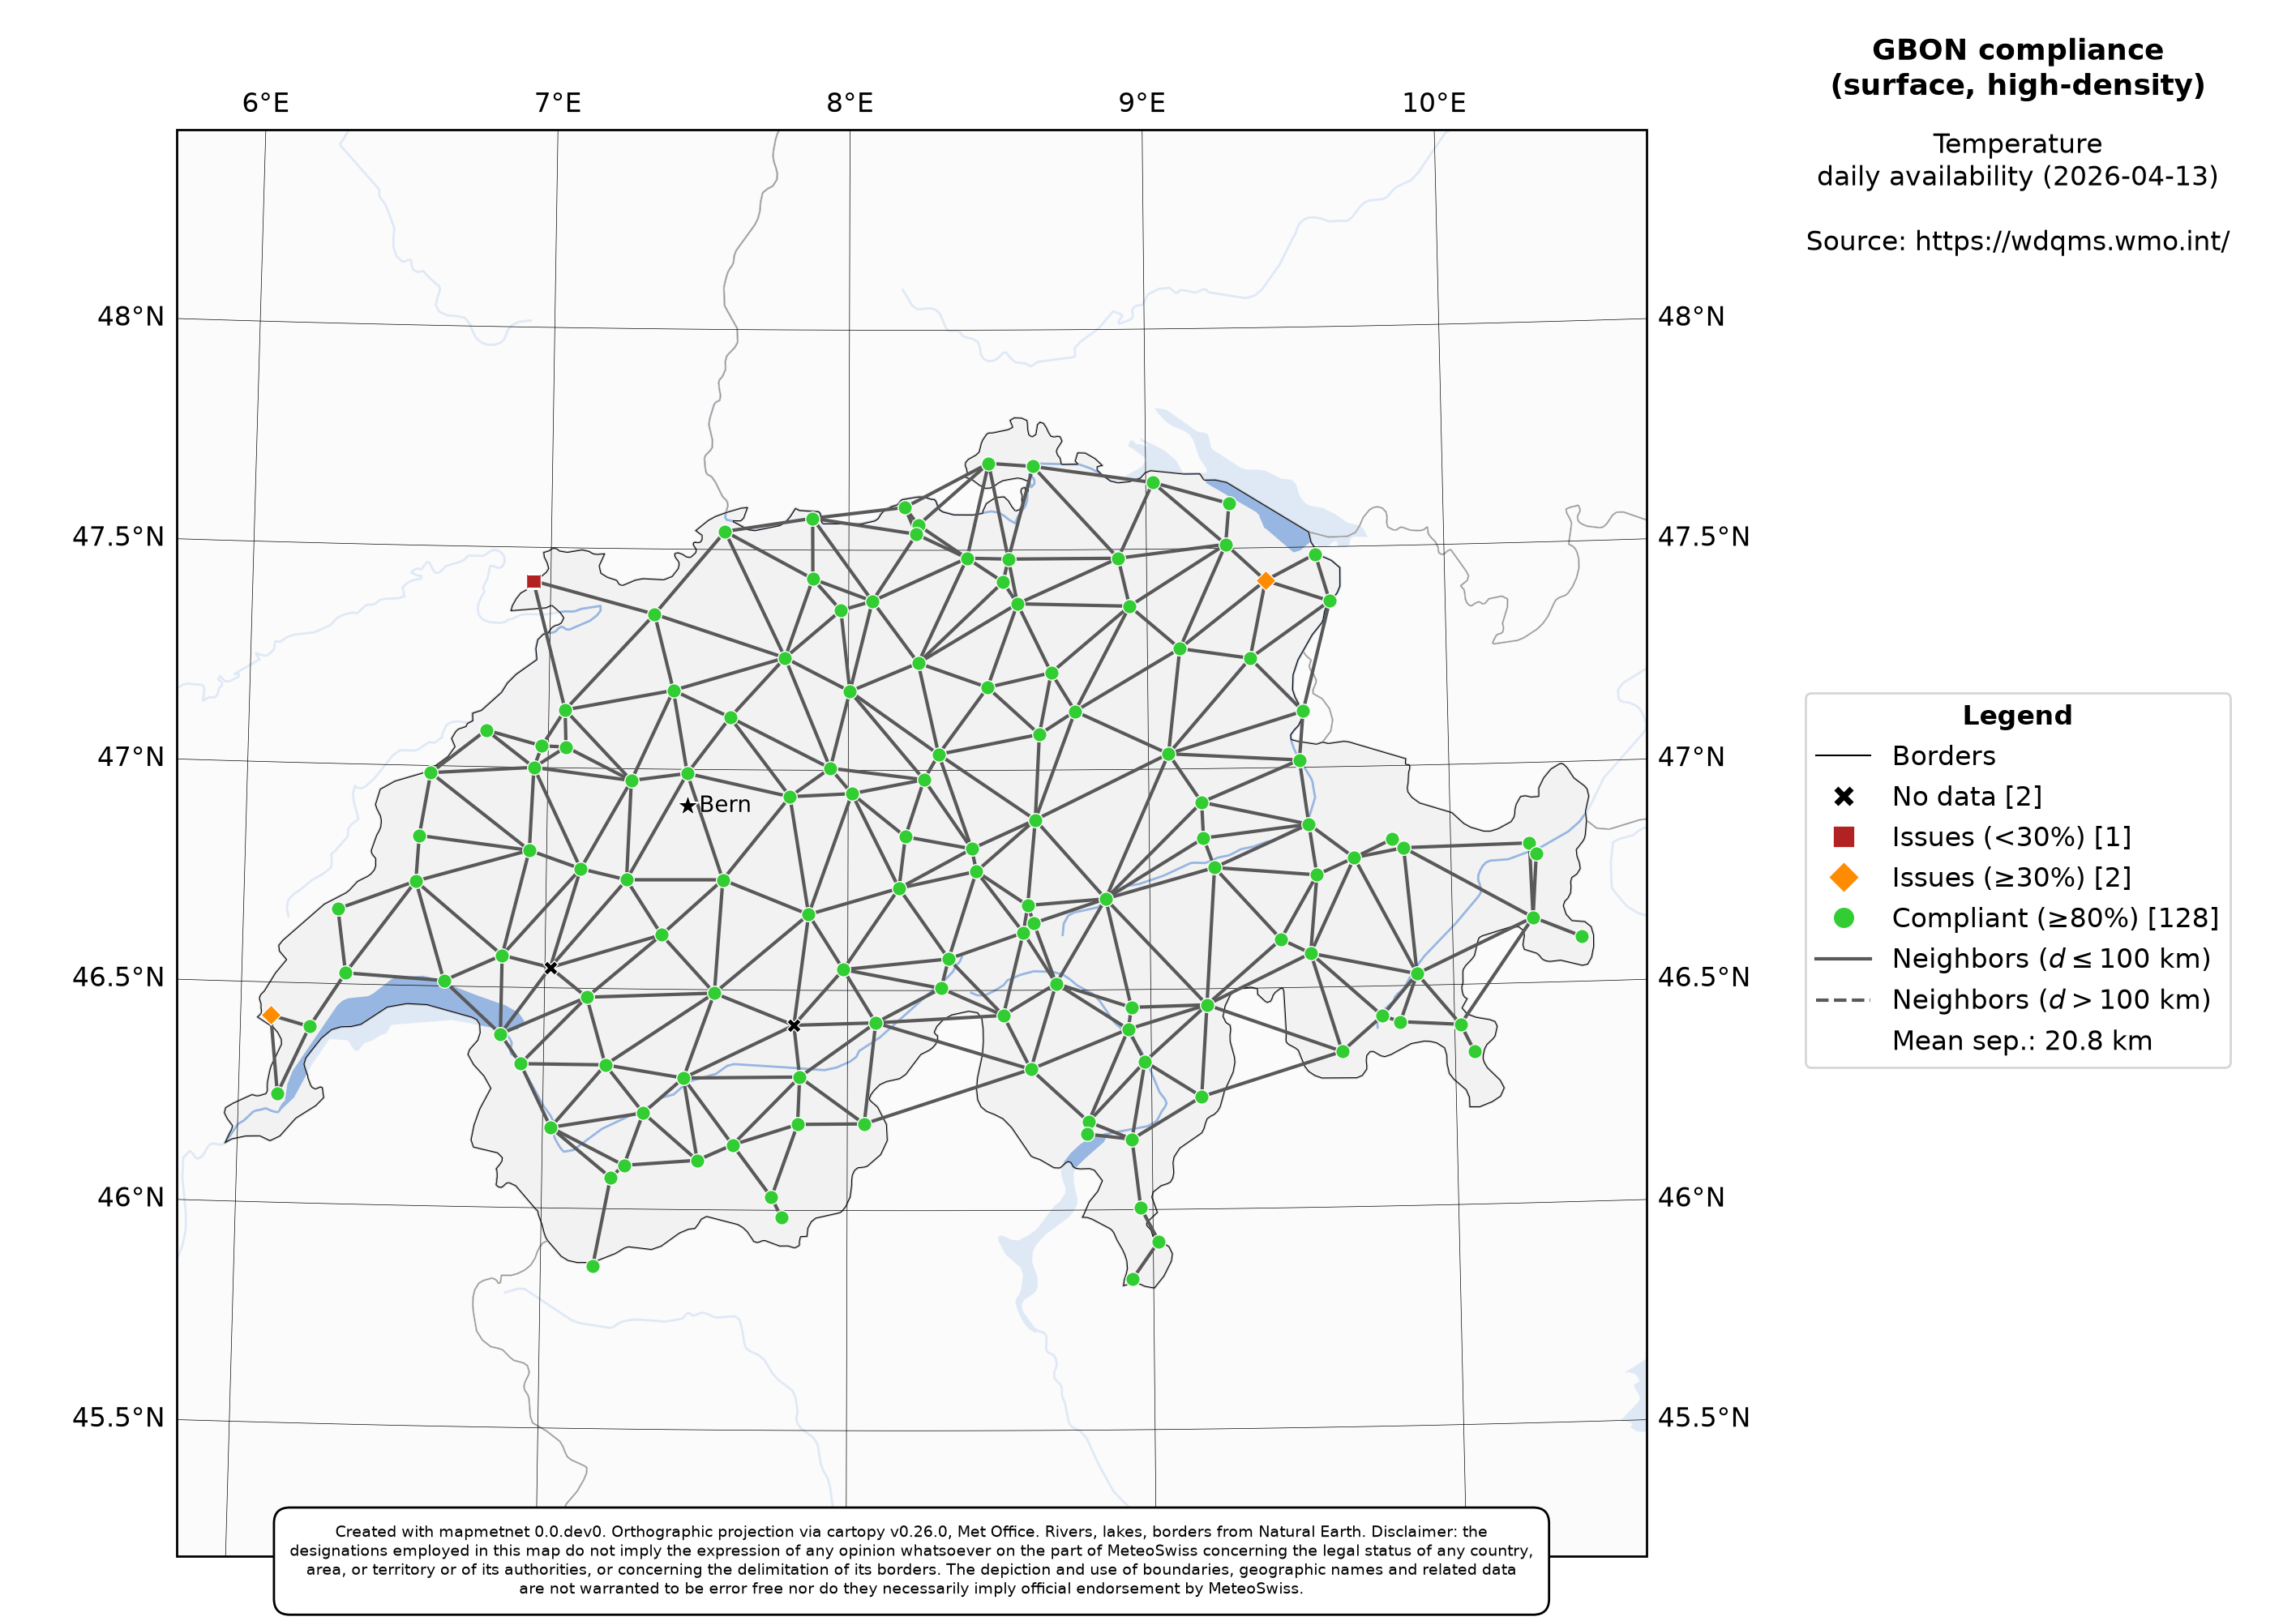
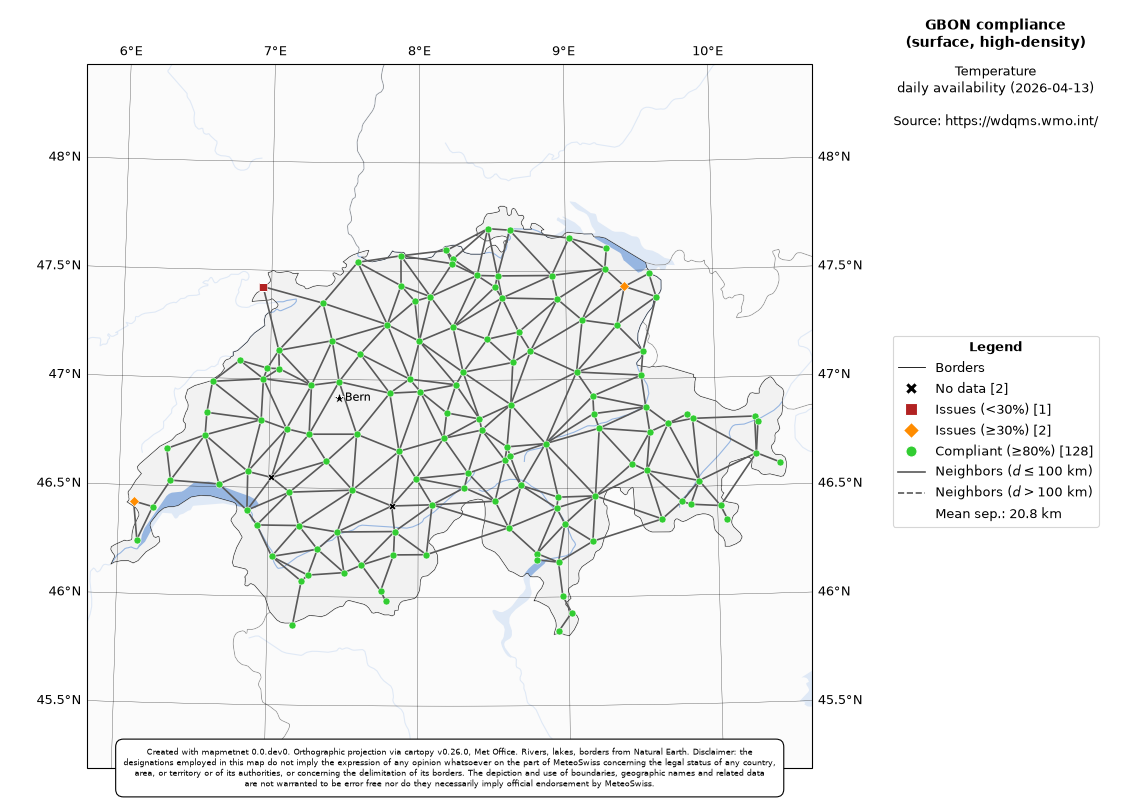
For more information on the different parameters of the resulting map, users can refer to the
documentation of the mapmetnet.mapper.GBONMapper.generate_map() method.
- generate_map(self, figid: int = 1, pad_frac: float = 0.2, background: str | None = None, station_type: str = 'surface', var_name: str = 'temperature', interval: str = 'monthly', category: str = 'availability', date: str = '2026-01', wigos_ids: str | list | None = None, show_influence_area: bool = False, high_density: bool = False, show_country_names: bool = False, ref_radius: float | int | None = None, save_fmts: str | list | None = None, show: bool = False) str | None
All-in-one routine to generate a fully-fledged GBON Country map.
- Parameters:
figid (int, optional) – the matplotlib figure ID. Will first close it if it already exists.
pad_frac (float, optional) – padding fraction around the edges. Defaults to 0.1 (=10%).
background (str, None) – map background. See
mapmetnet.mapper.Mapper.add_background()for supported options. Defaults to None.station_type (str) – either ‘surface’ or ‘upper-air’.
var_name (str) – name of variable, e.g. ‘Temperature’.
interval (str, optional) – assessment interval, i.e. one of [‘monthly’, ‘daily’, ‘six_hour’]. Defaults to ‘monthly’.
category (str, optional) – WDQMS category to query. Defaults to ‘availability’.
date (str, optional) – date of the availability assessment. Defaults to ‘2023-11’.
wigos_ids (list, optional) – Defaults to None. If specified, will be combined with the country code using OR to select stations to be drawn.
show_influence_area (bool, optional) – if True, will draw the baseline influence area of each station. Defaults to False.
high_density (bool, optional) – if True, will use the GBON high-density (a.k.a “should”) criteria for deriving the area of influence of stations.
show_country_names (bool, optional) – if True, will draw the names of countries on the map. Defaults to False.
ref_radius (int|float, optional) – if set, will draw a circle of ‘ref_radius’ km in radius around the capital.
save_fmts (str|list, optional) – a str or list of str of formats to save the map to, e.g. [‘pdf’, ‘png’]. Defaults to None (= no figure saved).
show (bool, optional) – if True, will call plt.show() at the end. Defaults to False.
- Returns:
the filename of the saved figure, if save_fmts was not None. Otherwise, None.
- Return type:
str
Note
The concept of baseline area of influence for a GBON station was introduced by Vogt et al., 2024, to which we refer the interested reader for details: see their Appendix A, and also the documentation of the associated Python implementation. In short, it corresponds to the area in the immediate vicinty of a station for which the GBON requirements (in terms station proximity) are met.
By setting
show_influence_areato True, the map will include a visual representation of the GBON baseline area of influence of every station. It will also add to the legend the percentage of the country that is covered by the combined GBON baseline area of influence of the total network.While this criteria (i.e. total country coverage) is NOT a formal GBON requirement per se (only the mean station separation is), we believe that it can still serve as a ueful indicator of the extent to which a given country is effectively covered by the GBON network, and which region, if any, may benefit most from the addition of new stations.
Customizing network maps#
The mapmetnet.mapper.GBONMapper.generate_map() provides a high-level entry point, with a
limited set of parameters to minimze complexity. In itself, this routine is little more than a
wrapper around a set of lower-level functions to build and customize a map step-by-step.
Users with specific needs (and feeling adventurous) may thus be interested to build their own custom
map by replicating, adjusting and expanding the different steps implemented in
mapmetnet.mapper.GBONMapper.generate_map(). For specific exemples, see the Custom example 1: international network
and Custom example 2: non-GBON stations.
We shall not describe here the different steps/options in details, but instead refer interested users to the relevant function docstrings instead. We shall merely note that these different steps are located in distinct hierarchical classes:
mapmetnet.mapper.NetworkMapper
└── mapmetnet.mapper.CountryMapper
    └── mapmetnet.mapper.GBONMapper
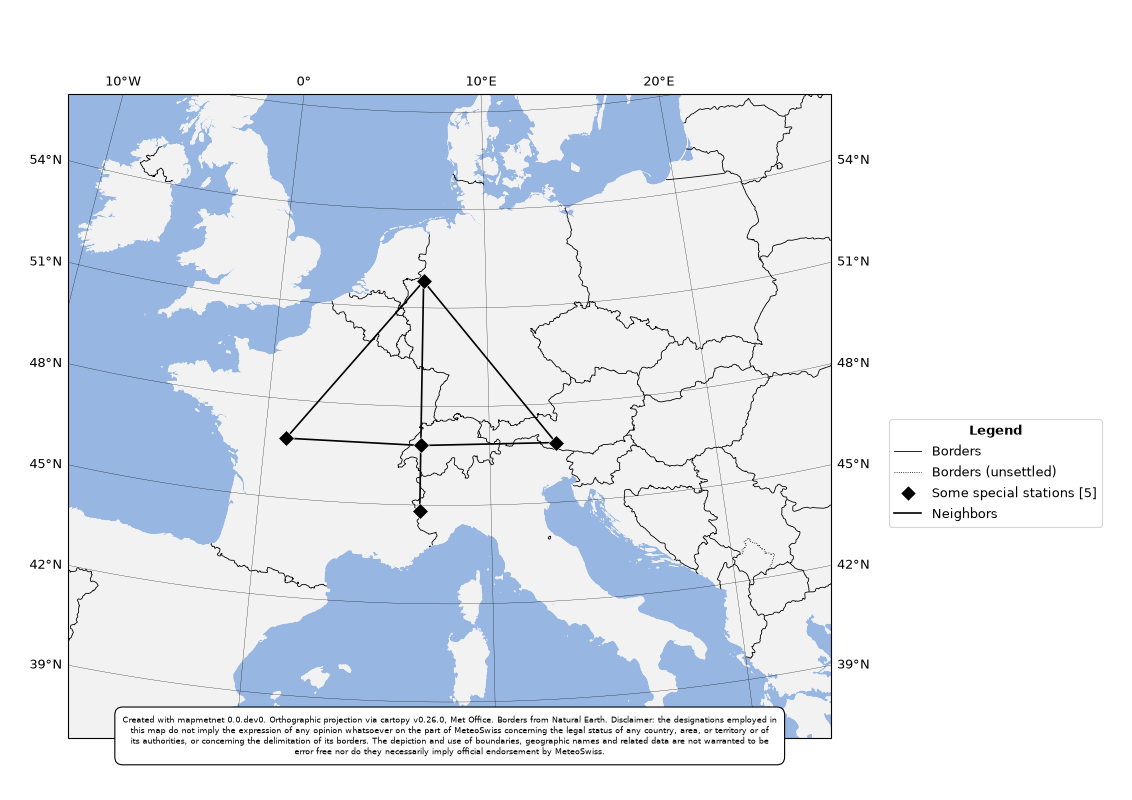
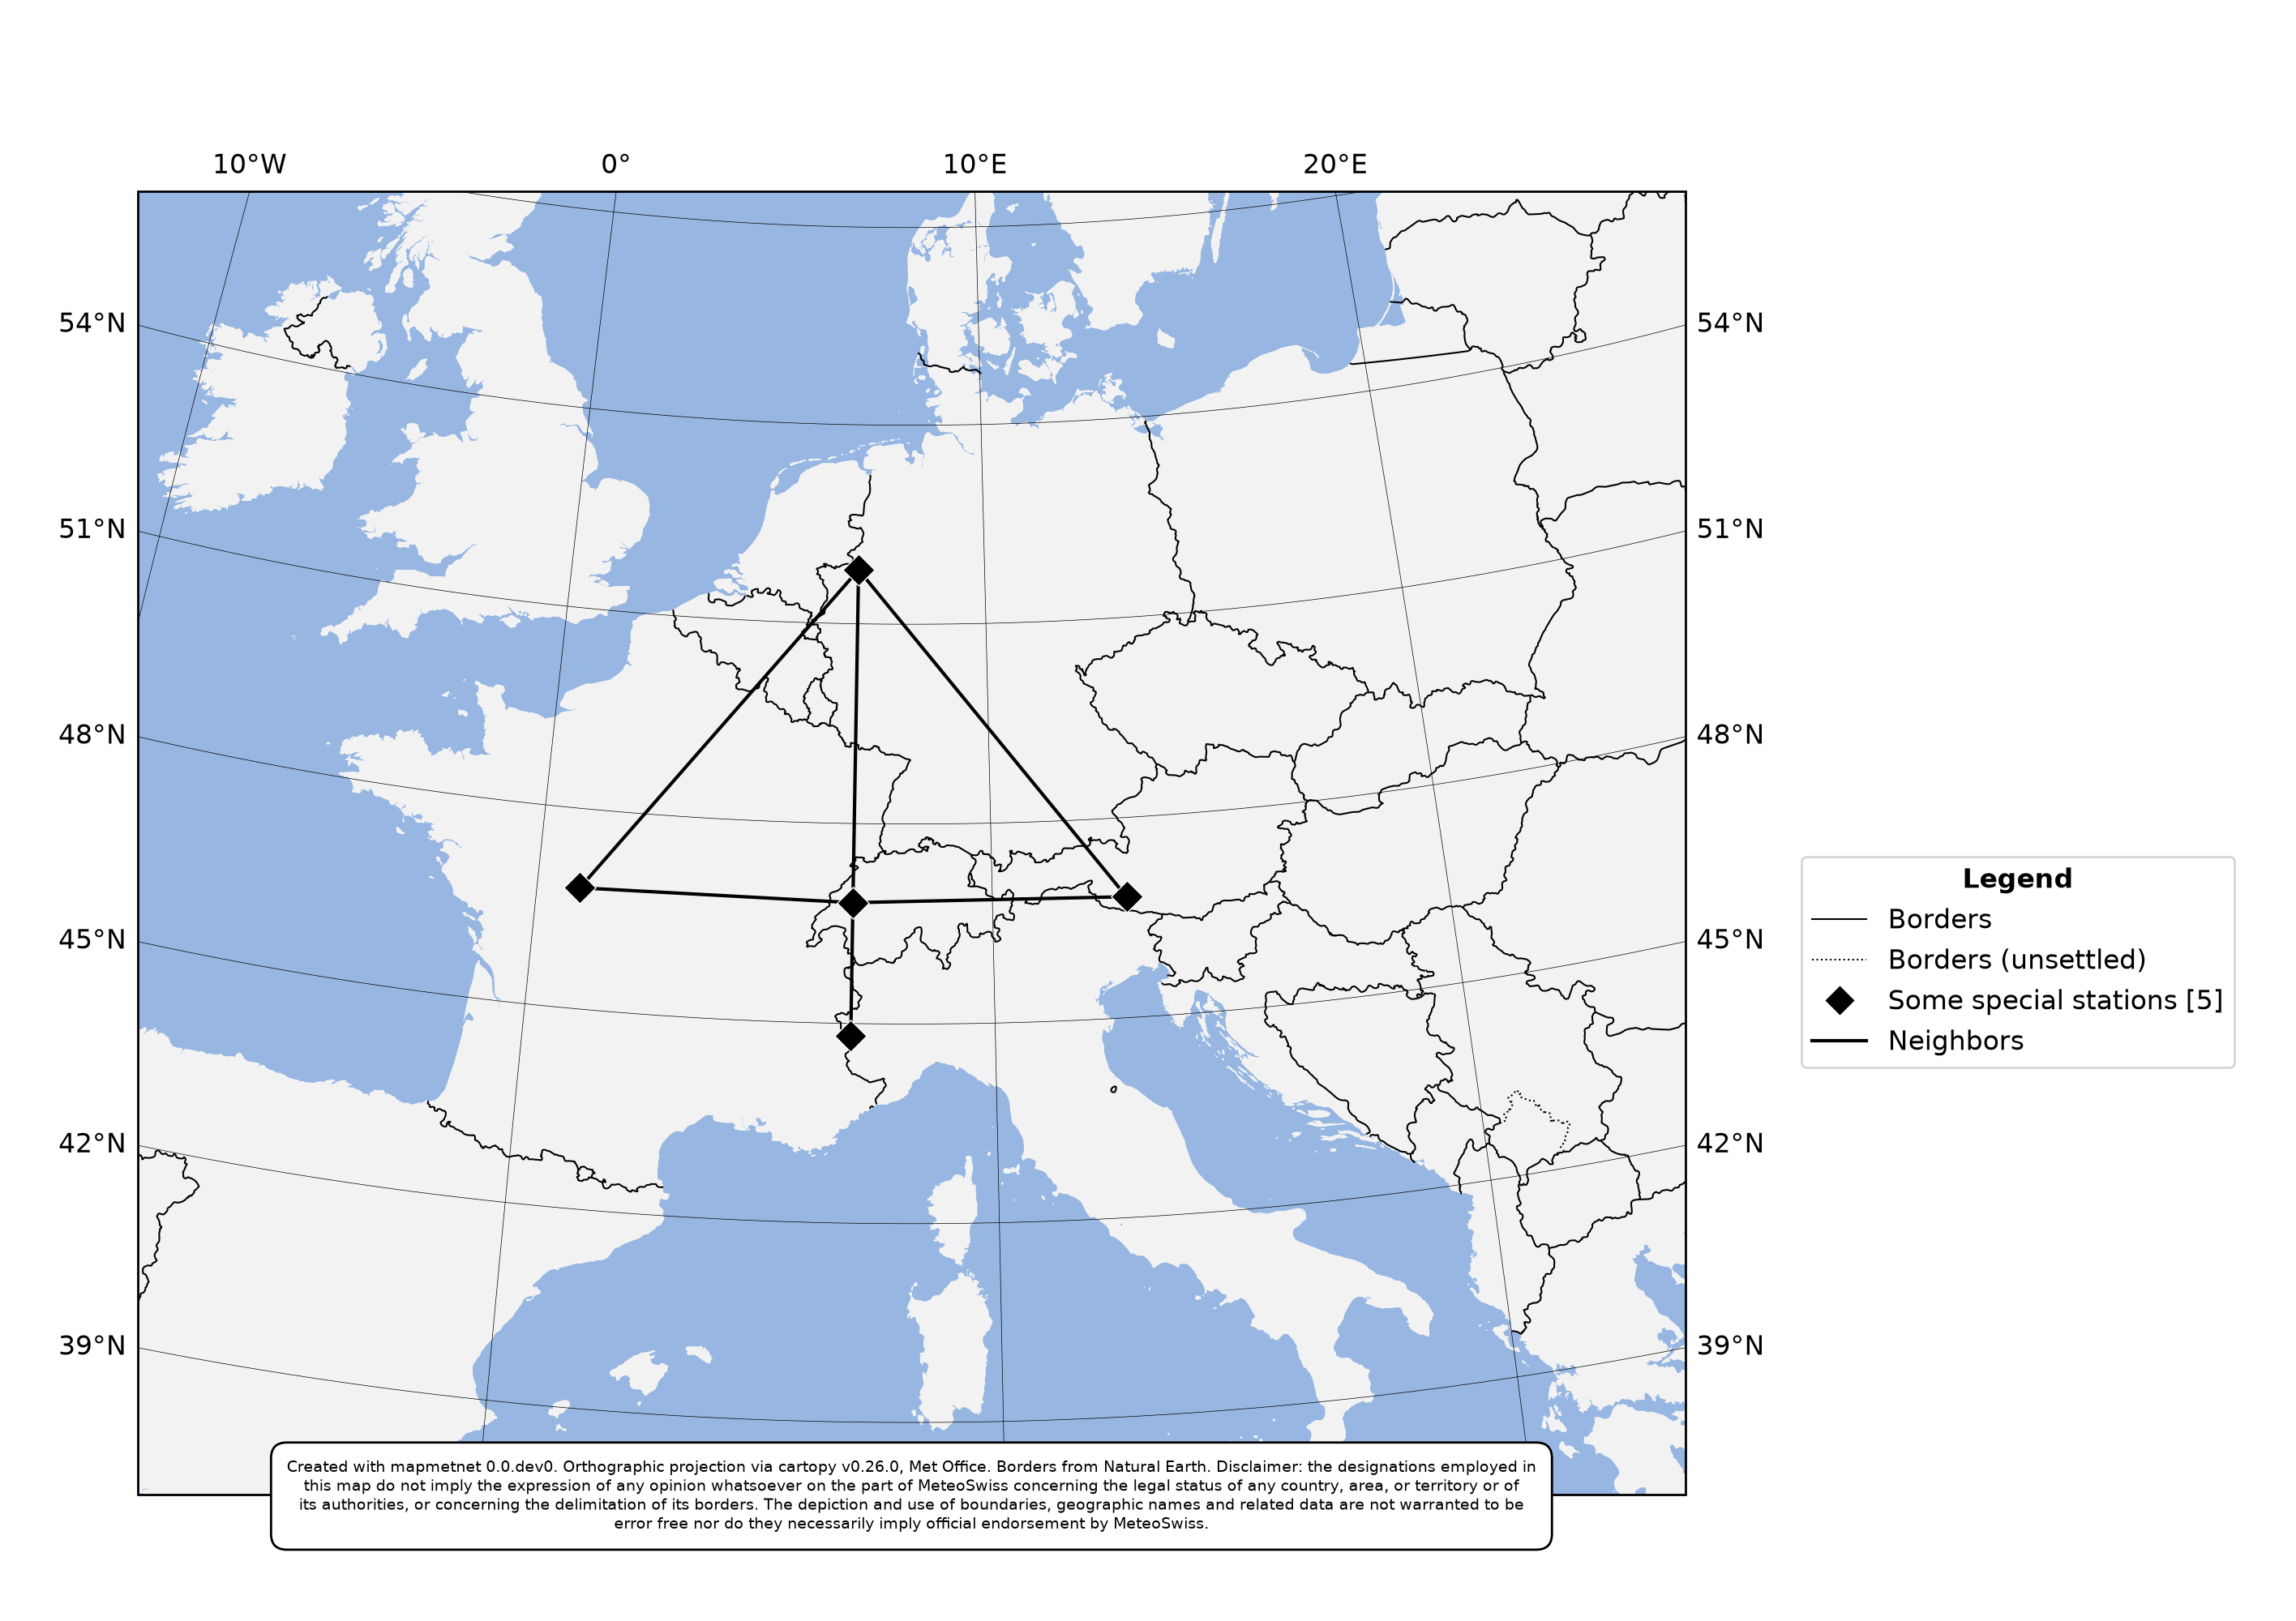
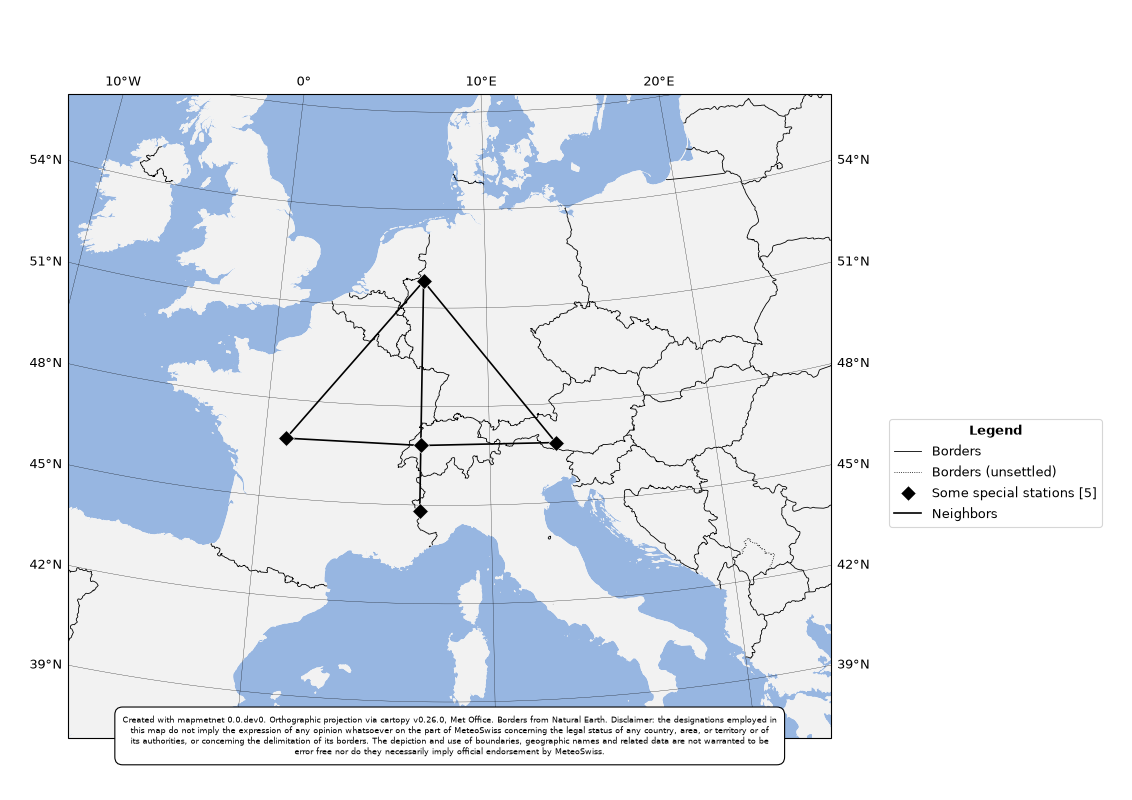
Custom example 1: international network#
import polars as pl
from mapmetnet.mapper import NetworkMapper

# Create a list of station coordinates as a polars DataFrame
stations = pl.DataFrame({
    'longitude': [6.943021, 0.943021, 12.943021, 6.943021, 6.943021],
    'latitude': [46.812724, 46.812724, 46.812724, 44.812724, 51.812724]
})

# Setup the map ... for this use case we need nothing more than the NetworkMapper class
mymap = NetworkMapper(lat=46.80111, lon=8.22667, extent=20)
mymap.create_fig(figid=1)
mymap.set_map_lims(squarify=True)

# Further tweak the look of things
mymap.add_background(which=None)
mymap.add_borders()
mymap.add_gridlines()

# Add the stations
comb, inter = mymap.add_stations(stations, influence_radius=None,
                                 marker='D', edgecolor='w', facecolor='k',
                                 size=100, label='Some special stations')

# Connect the stations
_ = mymap.link_neighbors(stations, color='k', thres=None)

# Finish up ...
mymap.add_copyright()
mymap.add_legend()
mymap.savefig('custom_network_map1.png')
mymap.show()
(Source code, png, hires.png, pdf)
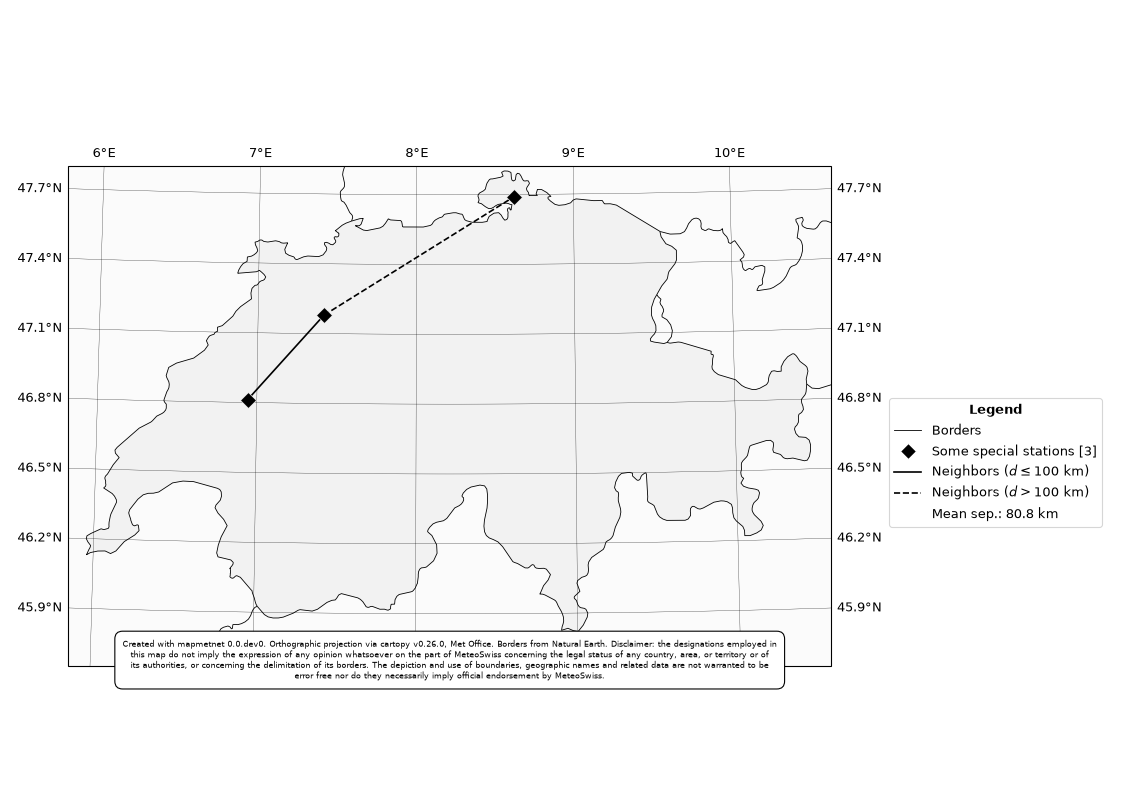
Custom example 2: non-GBON stations#
import polars as pl
import matplotlib.lines as mlines
from mapmetnet.mapper import CountryMapper

# Create a list of station coordinates as a polars DataFrame
stations = pl.DataFrame({
    'longitude': [6.943021, 7.415201, 8.62053],
    'latitude': [46.812724, 47.178870, 47.690021]
})

# Setup the map
mymap = CountryMapper('CHE')
mymap.create_fig(figid=1)

# Make it asymetric to better fit the country shape
mymap.set_map_lims(pad_frac=0.02, lat_max=47.8, lat_min=45.65, squarify=False)

# Further tweak the look of things
mymap.add_background(which=None)
mymap.highlight_country()
mymap.add_borders()
mymap.add_gridlines()

# Add the stations
comb, inter = mymap.add_stations(stations, influence_radius=None,
                                 marker='D', edgecolor='w', facecolor='k',
                                 size=100, label='Some special stations')

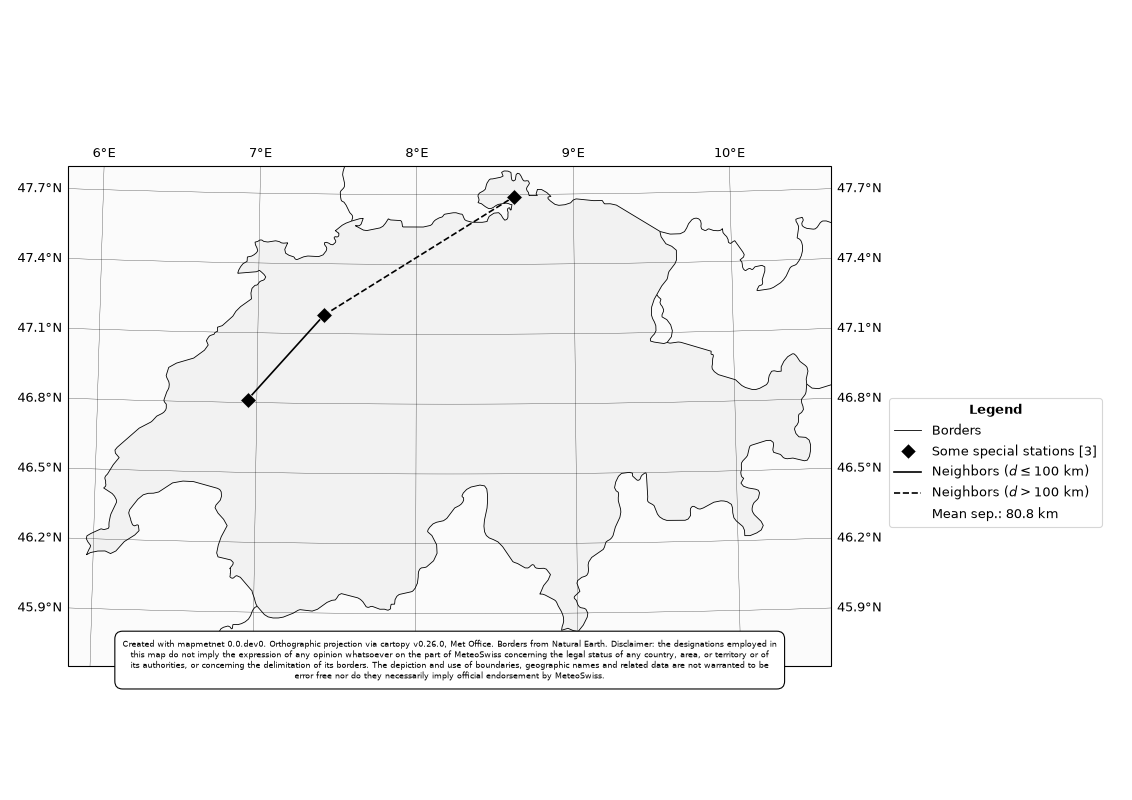
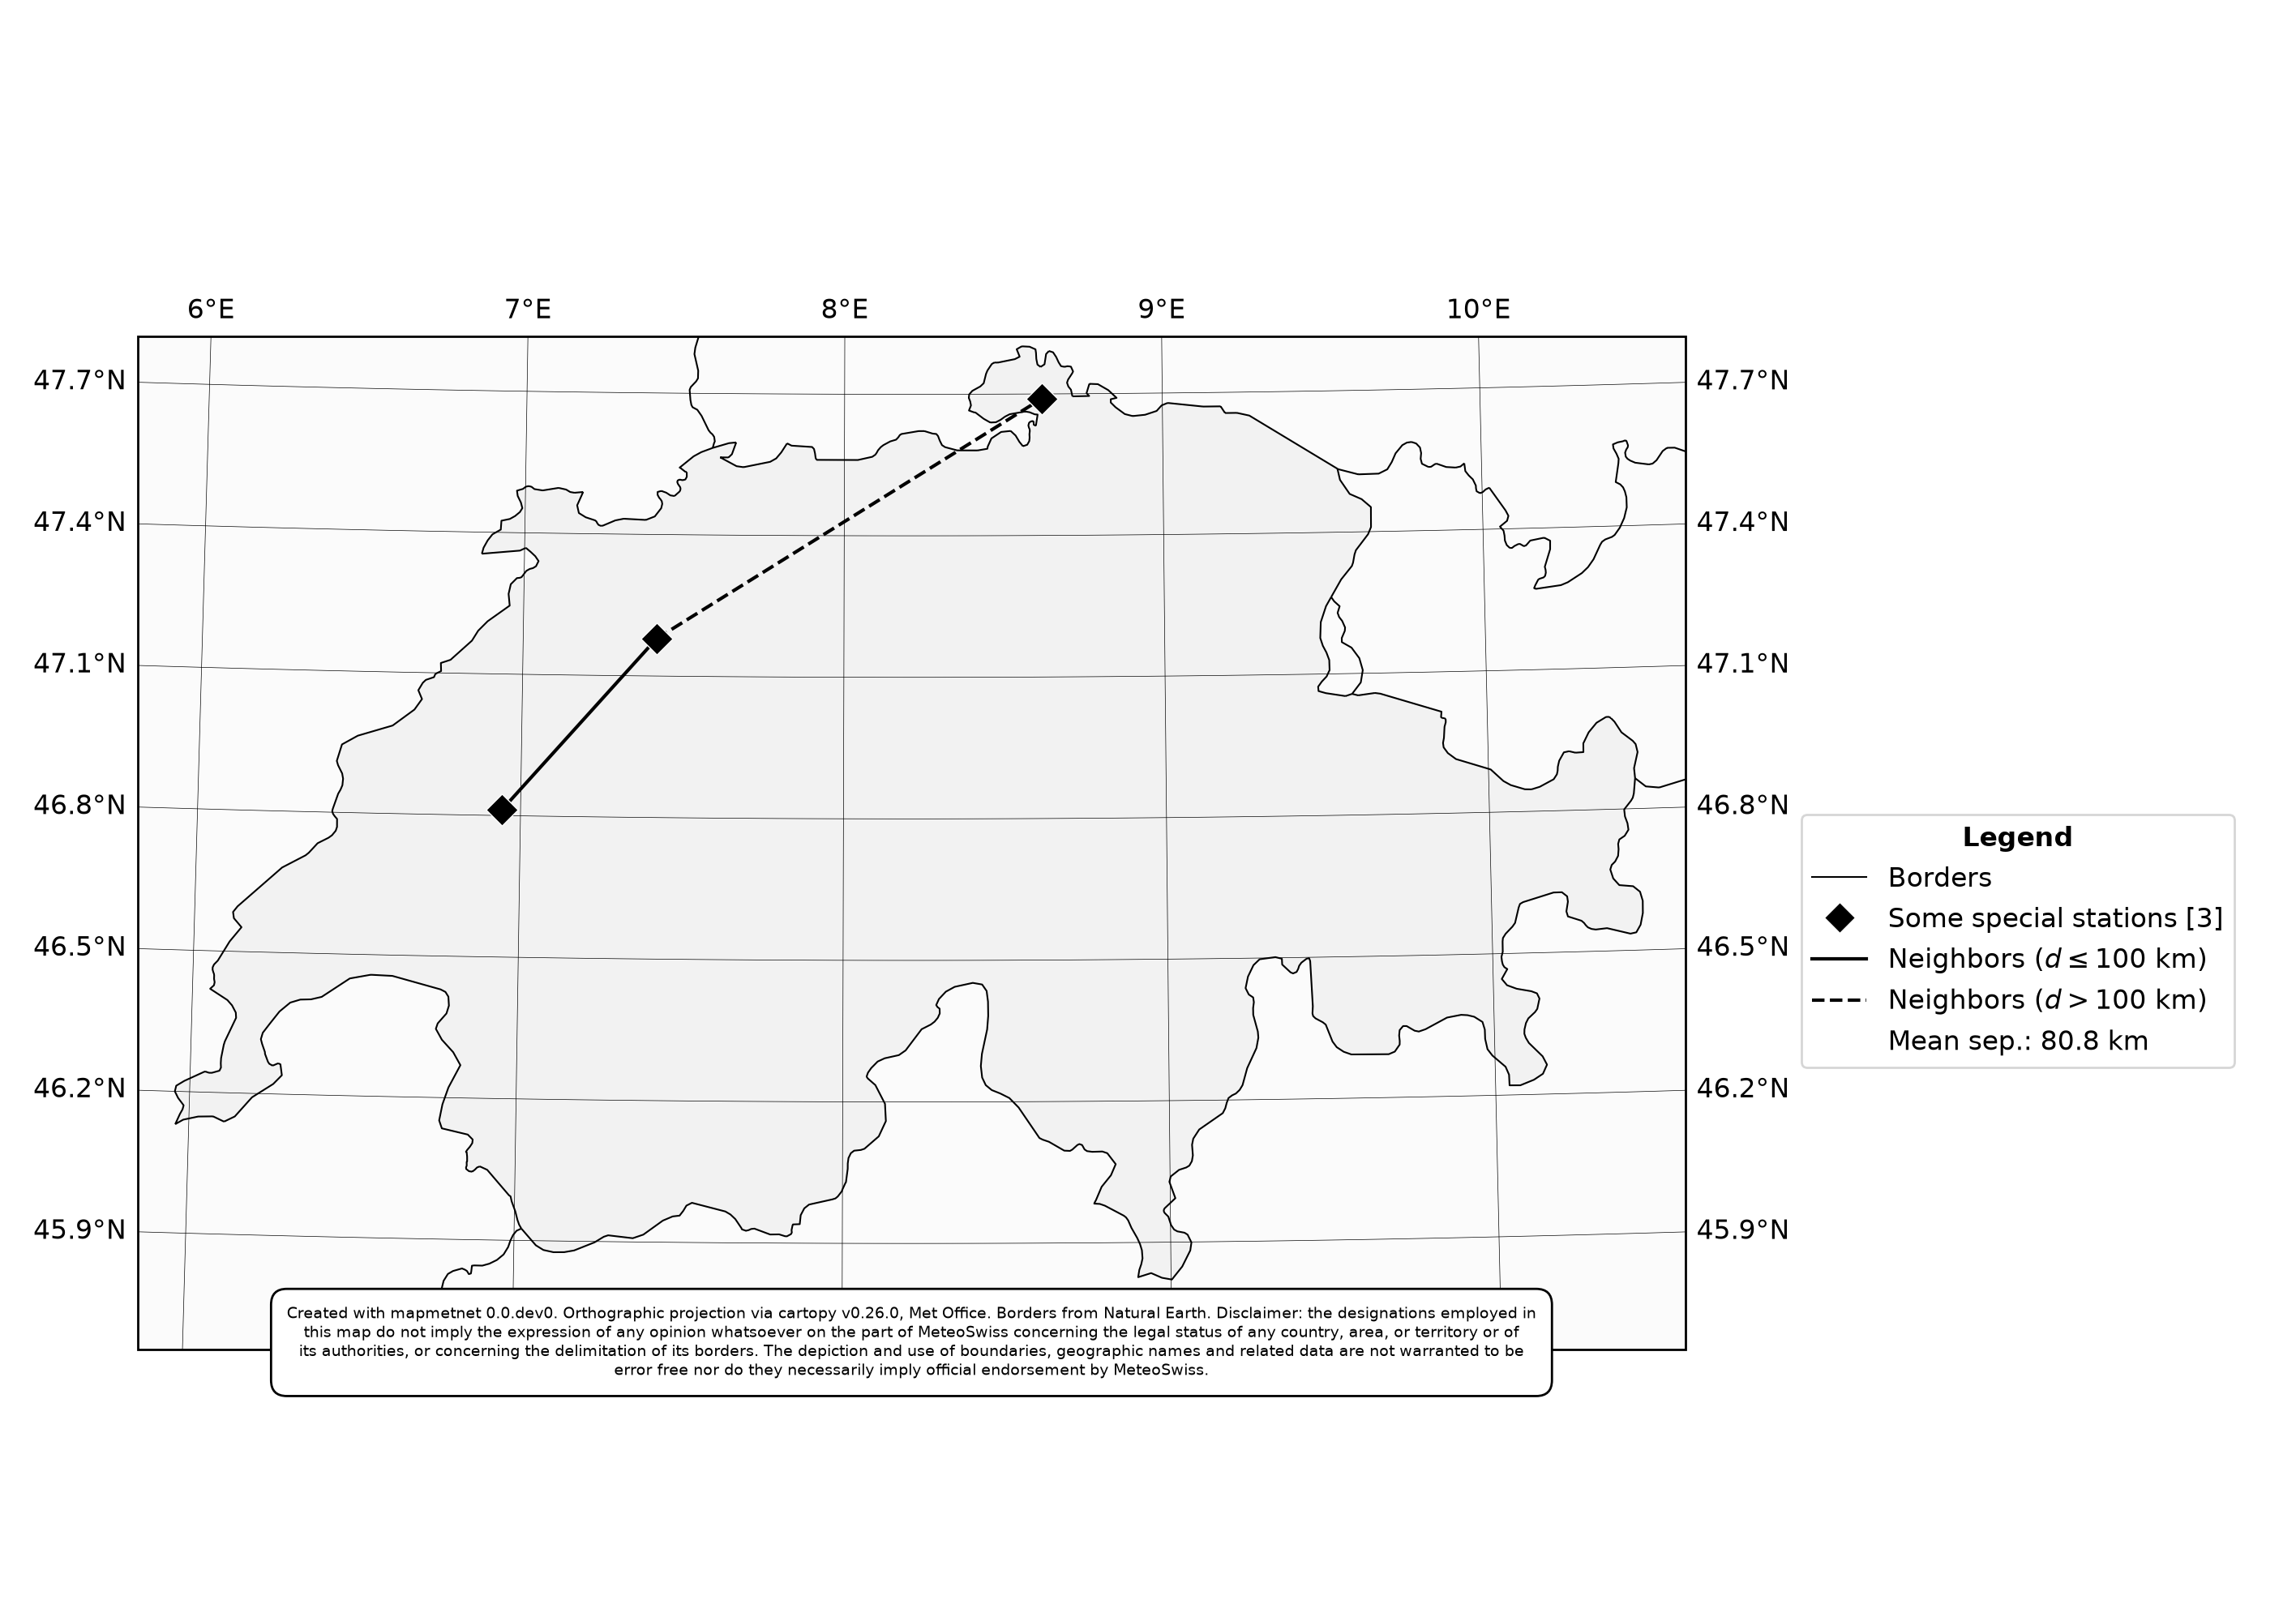
# Link stations and compute the mean separation ...
mean_sep = mymap.link_neighbors(stations, color='k', thres=100)
# ... and add this info to the legend
mymap._legend_handles['mean_sep'] = mlines.Line2D(
    [], [], color='none', ls='-', label=f'Mean sep.: {mean_sep:.1f} km')

# Finish up ...
mymap.add_copyright()
mymap.add_legend()
mymap.savefig('custom_network_map2.png')
mymap.show()
(Source code, png, hires.png, pdf)
Advanced options (for adventurous users)#
Exclusive Economic Zones (EEZ)#
It is possible to draw the Exclusive Economic Zones (EEZ) of target countries on the map, by
specifying the relevant Marine Regions Geographic IDengifier (MRGID) number when instantianting
either the mapmetnet.mapper.GBONMapper or mapmetnet.mapper.CountryMapper
classes:
from mapmetnet.mapper import GBONMapper

alb_map = GBONMapper('ALB', mrgid=2153)
alb_map.generate_map(...)
The MRGID number for a given country can be found on the Marine Regions website. For exemple, Albania has the MRGID number 2153.
Doing so requires, in turn, to install the relevant EEZ shapefiles locally, which cannot be shipped
with the code for legal reasons. To identify the correct install location, use the mapmetnet
entry point from a terminal:
$ mapmetnet

mapmetnet X.Y

Reference locations for supplementary material:

* Natural Earth: /Some/where/locally/src/mapmetnet/data/backgrounds

* EEZ shapefile: /Some/where/locally/src/mapmetnet/data/eez

For more info: https://MeteoSwiss.github.io/mapmetnet
Detailed install instructions can then be found under the README.md file located at the
designated EEZ location.
Natural Earth background#
mapmetnet can use the Natural Earth I with Shaded Relief, Water, and Drainages
high-resolution map as background via the background='ne' parameter in the
mapmetnet.mapper.GBONMapper.generate_map call. Doing so requires, in turn,
to place the relevant Natural Earth data locally (its large size prevents us from shipping it
with the code).
Here as well, use the mapmetnet high-level entry point to identify the correct install location and associated
README.md.