Reading and processing spectral data (Rainbow format)#
Spectral data is 3-dimensional radar obtained from the FFT of the IQ data. It has the following dimensions:
number of rays X number of range bins X number of velocity bins
whereas normal radar moments (that can be obtained by integrating on the last dimension of the spectrum) have only the dimensions
number of rays X number of range bins
Therefore, spectral data are treated differently in Py-ART and have their own reader and processing routines
To read spectral data and to create a Spectrum Py-ART object (similar to the normal Radar object but for spectral data) in the Raibow format you need to use the function read_rainbow_psr_spectra.
This reader requires you to provide a normal Rainbow file as well as one or more PSR (spectral files). The function will then use the normal rainbow file as a reference and will look for the spectrum data from all the provided files that matches the timestamps and angles in the normal rainbow file. The more files you provide as spectral files, the longer the reading will take, so it is good to filter a bit the relevant files yourself before.
In the example below we provide only the spectral files which have exactly the same timestamps in the filename as the original file.
import pyart
import glob
import os
import matplotlib.pyplot as plt
import cmweather
import numpy as np

os.environ["PSRLIB_PATH"] = "/home/malsplus/radarVgit/src/libDX50//lib/"
file_wrl = "/data/CAMPAIGNS/MEIRINGEN_2024/Instruments/50DX/Raw/MEI24_VERTPPI_el90_psr.azi/2025-06-02/2025060212462800dBZ.azi"
files_psr = glob.glob("/data/CAMPAIGNS/MEIRINGEN_2024/Instruments/50DX/PSR/MEI24_VERTPPI_el90_psr.azi/2025-06-02/202506021246*.ufh.psr.rd")
spectrum = pyart.aux_io.read_rainbow_psr_spectra(file_wrl, files_psr)
print(spectrum.fields.keys())
dict_keys(['transmitted_power_h', 'transmitted_power_v', 'spectral_noise_power_hh_ADU', 'spectral_noise_power_vv_ADU', 'spectral_noise_power_hv_ADU', 'spectral_noise_power_vh_ADU', 'complex_spectra_hh_ADU', 'complex_spectra_vv_ADU'])
Compute additional fields#
Spectral power#
Spectral power is computed by taking the norm of the complex spectrum in ADU. Optionally it can convert it to another unit (dBADU or dBm) and subtract noise from the power.
In our case we will compute it in dBm
spectral_power = pyart.retrieve.spectra.compute_spectral_power(spectrum, units="dBm", subtract_noise=True)
Add it to the spectrum objet
spectrum.fields["spectral_power_hh_dBm"] = spectral_power
Spectral reflectivity#
The spectral reflectivity requires the spectral power, you can either, first compute the spectral power and use it in the call to the function or you can do both at once. We will do both at once.
See compute_spectral_reflectivity for more information
spectral_refl = pyart.retrieve.spectra.compute_spectral_reflectivity(spectrum, compute_power=True, subtract_noise=True)
spectrum.fields["spectral_reflectivity_hh"] = spectral_refl
Similar functions exist for other spectral variables for example compute_spectral_phase or compute_spectral_differential_phase
print(spectrum.fields["spectral_reflectivity_hh"]["data"].shape)
print(spectrum.nrays)
print(spectrum.npulses_max)
print(spectrum.ngates)
(360, 500, 168)
360
168
500
Dimensions of spectral data is
nrays x npulses x ngates
npulses is the length of the FFT, so the number of velocity bins.
Velocity bins can be accesses with
vel_bins = spectrum.Doppler_velocity["data"]

plt.figure()
plt.pcolormesh(vel_bins)
plt.colorbar()
plt.ylabel("Ray index")
plt.xlabel("Range gate index")
Text(0.5, 0, 'Range gate index')
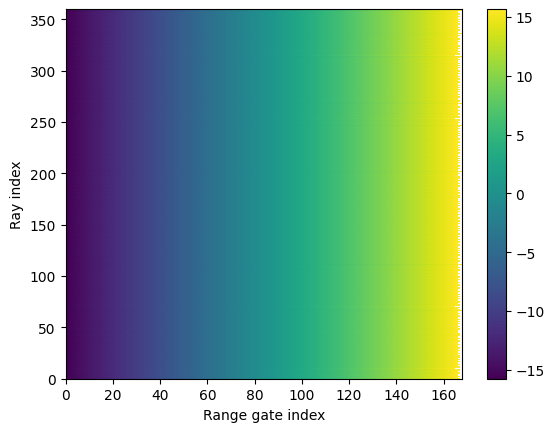
Note that typically the velocity bins are the same for all rays, as can be seen above
Radar moments#
All radar moments can be derived from the spectrum, you can either use the corresponding function for example compute_reflectivity or compute_differential_reflectivity or compute several at once compute_pol_variables to create a classical radar object.
radar = pyart.retrieve.spectra.compute_pol_variables(spectrum, ["reflectivity", "differential_reflectivity"], subtract_noise=True)
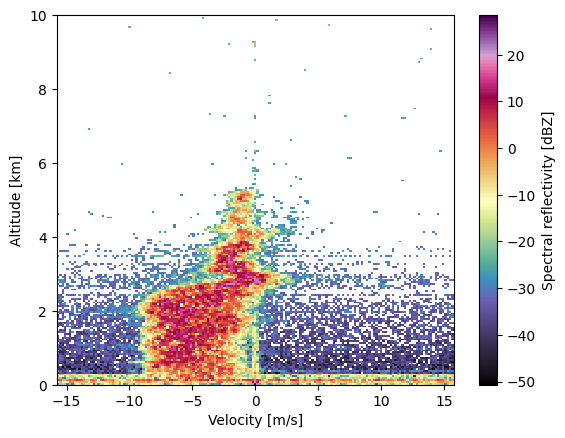
Make a plot of the spectral reflectivity#
ray = 0

xaxis = spectrum.Doppler_velocity["data"][ray].compressed()

xres = np.abs(xaxis[1] - xaxis[0])

yaxis = spectrum.range["data"] / 1000.0
yres = np.abs(yaxis[1] - yaxis[0])
xaxis_lim = np.append(xaxis - xres / 2, xaxis[-1] + xres / 2)
yaxis_lim = np.append(yaxis - yres / 2, yaxis[-1] + yres / 2)

field_2D = spectrum.fields["spectral_reflectivity_hh"]["data"][ray, :, 0 : vel_bins_ray.size]

X, Y = np.meshgrid(xaxis_lim, yaxis_lim)

plt.pcolormesh(X,Y, field_2D, cmap = cmweather.cm_colorblind.ChaseSpectral)
plt.colorbar(label = "Spectral reflectivity [dBZ]")
plt.ylim([0,10])
plt.xlabel("Velocity [m/s]")
plt.ylabel("Altitude [km]")
Text(0, 0.5, 'Altitude [km]')