Plotting of radar data#
This notebook summarizes the main plots that can be generated by pyrad, and gives some info on how to configure the display of these plots
PPI_IMAGE#
This product plots a classical PPI image of radar data in radar-centered AEQD coordinates.
Besides the parameters listed in the product description, this type of plot uses the ppiImageConfig structure in the loc file.
Parameter |
Type |
Description |
|---|---|---|
dpi |
INT |
dpi of the output image |
xsize |
FLOAT |
width of the image in inches |
ysize |
FLOAT |
height of the image in inches |
ymin |
FLOAT |
minimum displayed y-coordinate (northwards, in radar centric coordinates) |
ymax |
FLOAT |
minimum displayed y-coordinate (northwards, in radar centric coordinates) |
xmin |
FLOAT |
minimum displayed x-coordinate (eastwards, in radar centric coordinates) |
xmax |
FLOAT |
minimum displayed x-coordinate (northwards, in radar centric coordinates) |
rngRing |
INT |
if defined will plot range rings every x kilometers from the radar (x value) |
Example#
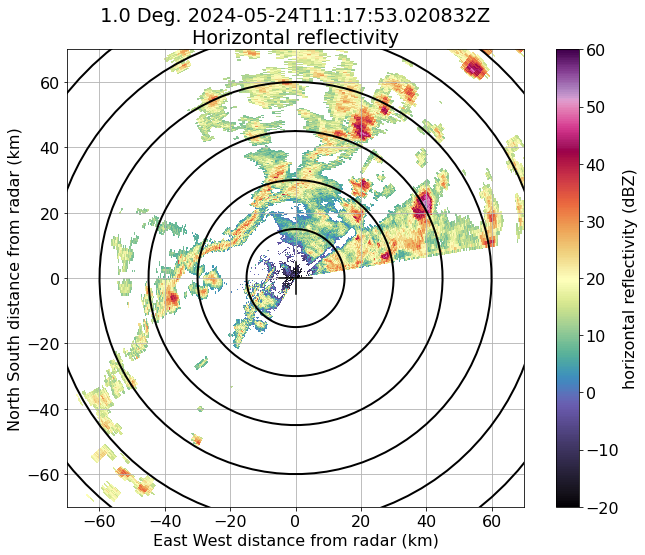
Generated with
Product definition
PPI_IMAGE_EL1 STRUCT 5
    type  STRING PPI_IMAGE
    anglenr INT 0
    vmin FLOAT -20
    vmax FLOAT 60
    voltype STRING dBZ
ppiImageConfig definition
ppiImageConfig STRUCT 7
    xsize      FLOAT  10.
    ysize      FLOAT   8.
    xmin       FLOAT -70.0
    xmax       FLOAT  70.0
    ymin       FLOAT -70.0
    ymax       FLOAT  70.0
    rngRing    INT    15
NOTE
The product PSEUDOPPI_IMAGE and CAPPI_IMAGE also use the ppiImageConfig structure.
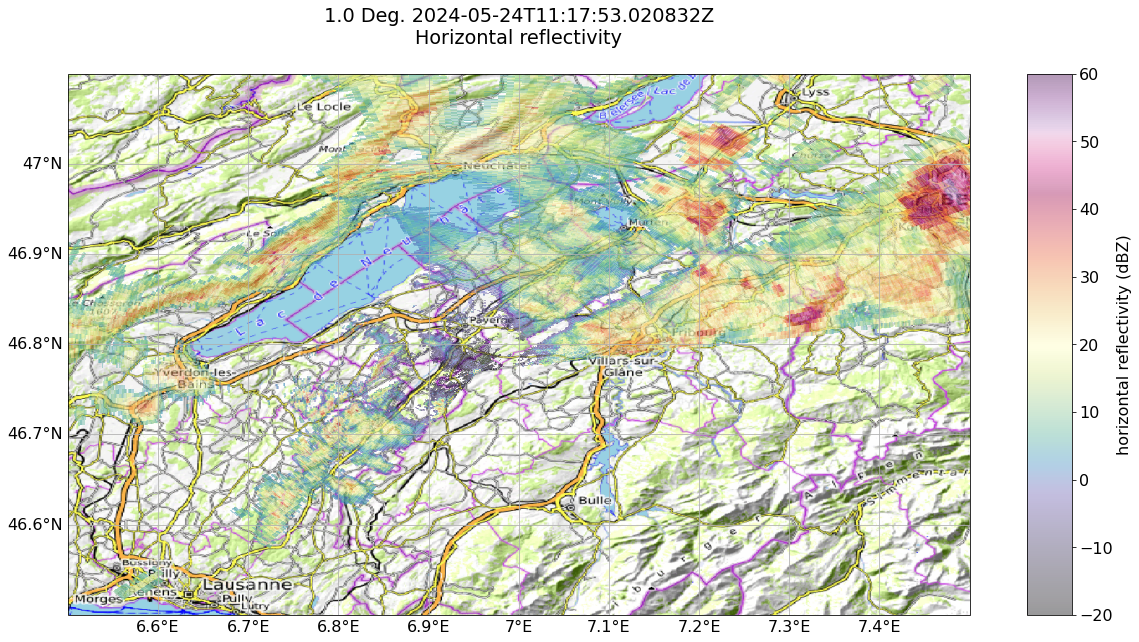
PPI_MAP#
This product plots a PPI over a geo-referenced cartopy map in lat/lon coordinates.
Besides the parameters listed in the product description, this type of plot uses the ppiImageConfig structure in the loc file.
Parameter |
Type |
Description |
|---|---|---|
dpi |
INT |
dpi of the output image |
xsize |
FLOAT |
width of the image in inches |
ysize |
FLOAT |
height of the image in inches |
min_lon |
FLOAT |
minimum displayed longitude |
max_lon |
FLOAT |
maximum displayed longitude |
min_lat |
FLOAT |
minimum displayed latitude |
max_lat |
FLOAT |
maximum displayed latitude |
resolution |
INT |
resolution of additional cartopy geodata, only “10m”, “50m” or “110m” is supported |
alpha |
FLOAT |
transparency value (between 0 and 1) of the displayed radar data, alpha < 1 is required when plotting over a relief or OTM map |
background_zoom |
INT |
Zoom level of the additional cartopy raster geodata, higher values mean higher resolution (typically between 8 and 12). Default is 8. |
maps |
list of STRING |
list of additional geodata to plot. Supported: relief, OTM, provinces, urban_areas, roads, railroads, coastlines, lakes, lakes_europe, rivers, rivers_europe |
rngRing |
INT |
if defined will plot range rings every x kilometers from the radar (x is the specified value) |
Example#
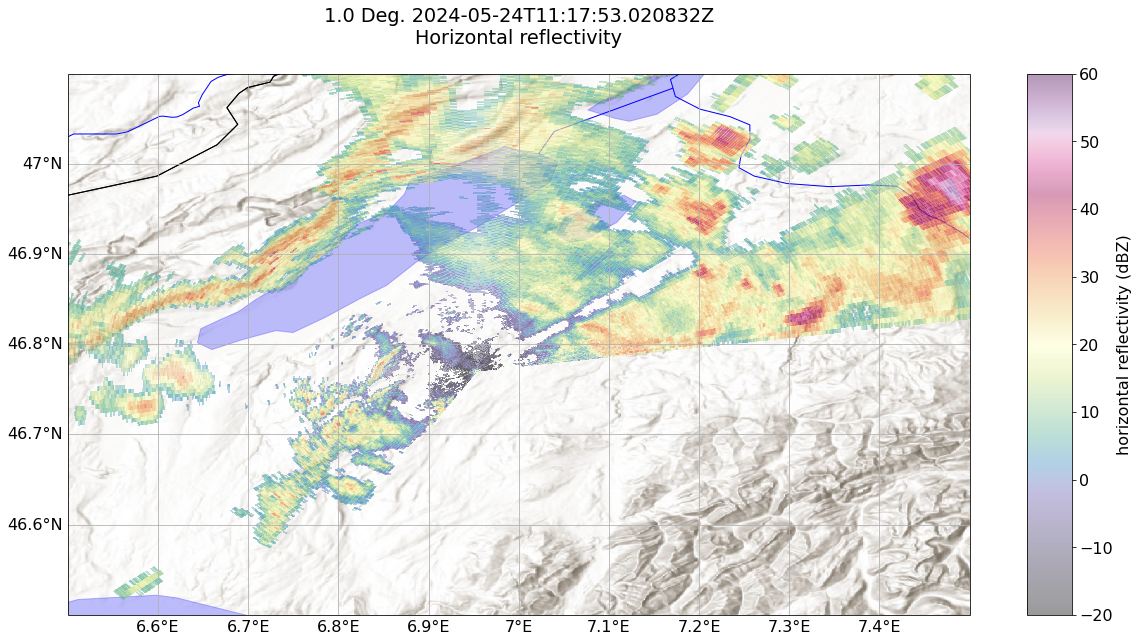
Generated with
Product definition
PPI_MAP_EL1 STRUCT 5
    type  STRING PPI_MAP
    anglenr INT 0
    vmin FLOAT -20
    vmax FLOAT 60
    voltype STRING dBZ
ppiMapImageConfig definition
ppiMapImageConfig STRUCT 12
    mapres STRING 10m
    alpha FLOAT 0.4
    latmin FLOAT 46.5
    latmax FLOAT 47.1
    lonmin FLOAT 6.5
    lonmax FLOAT 7.5
    lonstep FLOAT 0.1
    latstep FLOAT 0.1
    xsize FLOAT 18.
    ysize FLOAT  10.
    background_zoom INT 10
    maps STRARR 7        # maps to overplot (cartopy)
        lakes
        countries
        lakes_europe
        coastlines
        rivers
        rivers_europe
        relief
Using instead
maps STRARR 1        # maps to overplot (cartopy)
    OTM
gives the following map
RHI_IMAGE#
This product plots a classical RHI image of radar data along a vertical profile.
Besides the parameters listed in the product description, this type of plot uses the rhiImageConfig structure in the loc file.
Parameter |
Type |
Description |
|---|---|---|
dpi |
INT |
dpi of the output image |
xsize |
FLOAT |
width of the image in inches |
ysize |
FLOAT |
height of the image in inches |
ymin |
FLOAT |
minimum displayed y-coordinate (altitude) |
ymax |
FLOAT |
minimum displayed y-coordinate (altitude) |
xmin |
FLOAT |
minimum displayed x-coordinate (distance at ground along RHI) |
xmax |
FLOAT |
minimum displayed x-coordinate (distance at ground along RHI) |
Example#
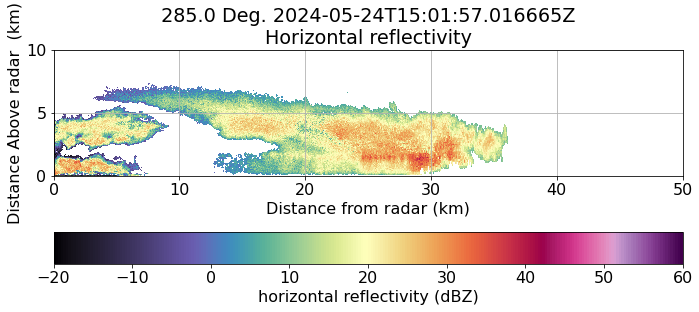
Generated with
Product definition
RHI_IMAGE_AZ285 STRUCT 5
    type  STRING RHI_IMAGE
    anglenr INT 0
    vmin FLOAT -20
    vmax FLOAT 60
    voltype STRING dBZ
rhiImageConfig definition
rhiImageConfig STRUCT 6
    xsize      FLOAT  10.
    ysize      FLOAT   6.
    xmin       FLOAT 0
    xmax       FLOAT 50.0
    ymin       FLOAT   0.0
    ymax       FLOAT  10.0
NOTE
The product PSEUDORHI_IMAGE works exactly in the same way.
SURFACE_IMAGE#
This product plots gridded (Cartesian) data over a geo-referenced cartopy map in lat/lon coordinates.
Besides the parameters listed in the product description, this type of plot uses the gridMapImageConfig structure in the loc file.
Parameter |
Type |
Description |
|---|---|---|
dpi |
INT |
dpi of the output image |
xsize |
FLOAT |
width of the image in inches |
ysize |
FLOAT |
height of the image in inches |
min_lon |
FLOAT |
minimum displayed longitude |
max_lon |
FLOAT |
maximum displayed longitude |
min_lat |
FLOAT |
minimum displayed latitude |
max_lat |
FLOAT |
maximum displayed latitude |
resolution |
INT |
resolution of additional cartopy geodata, only “10m”, “50m” or “110m” is supported |
alpha |
FLOAT |
transparency value (between 0 and 1) of the displayed radar data; alpha < 1 is required when plotting over a relief or OTM map |
background_zoom |
INT |
Zoom level of the additional cartopy raster geodata; higher values mean higher resolution (typically between 8 and 12). Default is 8. |
maps |
list of STRING |
list of additional geodata to plot. Supported: relief, OTM, provinces, urban_areas, roads, railroads, coastlines, lakes, lakes_europe, rivers, rivers_europe |
Example#
Generated with
Dataset and Product definition
maxecho STRUCT 7
type STRING GRID_STATS
datatype STRING dBZ
wfunc STRING GRID
statistic STRING max
weighted INT 0
gridConfig STRUCT 10
xmin FLOAT -30.
xmax FLOAT 30.
ymin FLOAT -30.
ymax FLOAT 30.
zmin FLOAT 0.
zmax FLOAT 15000.
hres FLOAT 1000.
altorig FLOAT 429.
latorig FLOAT 46.83
lonorig FLOAT 6.79
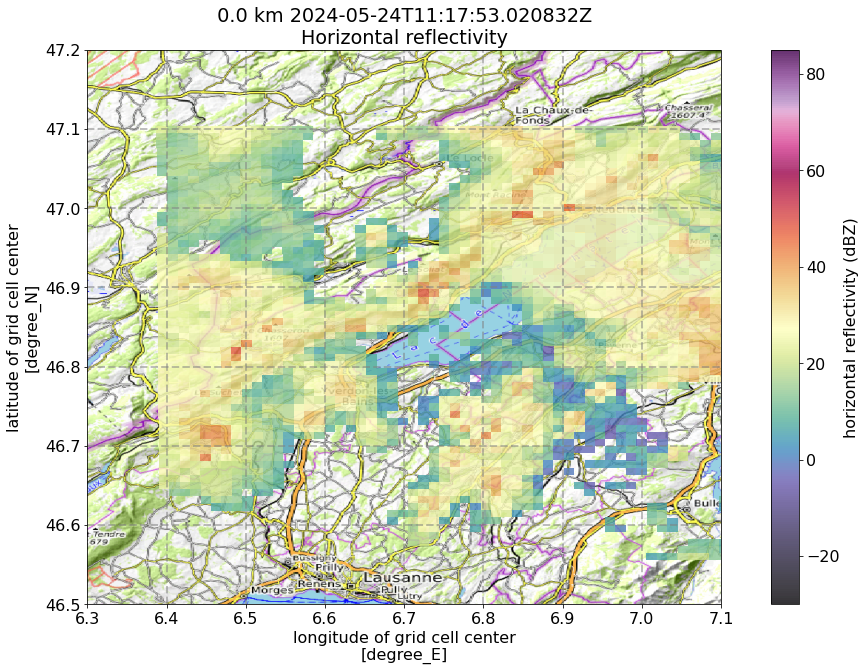
products STRUCT 1
SURFACE STRUCT 3
type STRING SURFACE_IMAGE
voltype STRING dBZ
level INT 0
gridMapImageConfig definition
gridMapImageConfig STRUCT 12
    mapres STRING 10m
    alpha FLOAT 0.8
    latmin FLOAT 46.5
    latmax FLOAT 47.1
    lonmin FLOAT 6.3
    lonmax FLOAT 7.1
    lonstep FLOAT 0.1
    latstep FLOAT 0.1
    xsize FLOAT 18.
    ysize FLOAT  10.
    background_zoom INT 10
    maps STRARR 1
        OTM
CROSS_SECTION#
This product plots a cross-section but on gridded Cartesian data. It can be seen as the equivalent of RHI_IMAGE but for gridded data.
Besides the parameters listed in the product description, this type of plot uses the xsecImageConfig structure in the loc file.
Parameter |
Type |
Description |
|---|---|---|
dpi |
INT |
dpi of the output image |
xsize |
FLOAT |
width of the image in inches |
ysize |
FLOAT |
height of the image in inches |
ymin |
FLOAT |
minimum displayed y-coordinate (altitude) |
ymax |
FLOAT |
maximum displayed y-coordinate (altitude) |
Note: a similar product exists for volumetric data but it uses instead the rhiImageConfig structure in the log file
Example#
Generated with
Product definition
profile STRUCT 5
type STRING GRID
datatype STRING dBZ
wfunc STRING NEAREST
gridConfig STRUCT 11
xmin FLOAT -30.
xmax FLOAT 30.
ymin FLOAT -30.
ymax FLOAT 30.
zmin FLOAT 0.
zmax FLOAT 15000.
hres FLOAT 1000.
vres FLOAT 200.
altorig FLOAT 429.
latorig FLOAT 46.83
lonorig FLOAT 6.79
products STRUCT 1
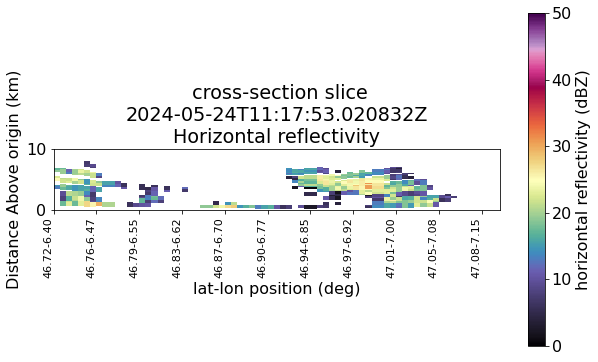
CROSS_SECTION STRUCT 5
type STRING CROSS_SECTION
voltype STRING dBZ
vmin FLOAT 0
vmax FLOAT 50
coord1 STRUCT 2
lat FLOAT 46.723
lon FLOAT 6.384
coord2 STRUCT 2
lat FLOAT 47.166
lon FLOAT 7.115
xsecImageConfig definition
xsecImageConfig STRUCT 4
    xsize      FLOAT  10.
    ysize      FLOAT   6.
    ymin       FLOAT   0.0
    ymax       FLOAT  10.0
NOTE
The product PSEUDORHI_IMAGE works exactly in the same way.