Note
Go to the end to download the full example code.
Calculate and Plot VAD profile#
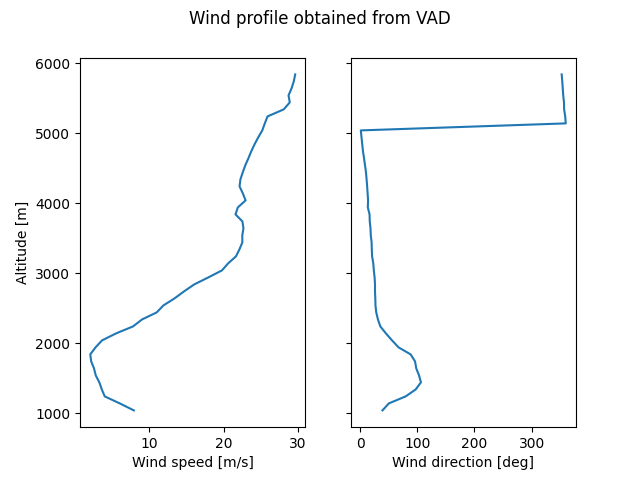
Calculates a VAD and plots a vertical profile of wind

max height 2919.4178130067885  meters
min height -50.10761547461152  meters
max height 5509.768666450866  meters
min height 1.7536260737106204  meters
max height 8052.019321078435  meters
min height 4.342043600045145  meters
max height 10640.04439644888  meters
min height 6.977913962677121  meters
max height 14495.494732164778  meters
min height 10.906225782819092  meters
max height 18768.789393587038  meters
min height 15.262494841590524  meters
max height 23035.24401461892  meters
min height 19.614115744829178  meters
max height 27293.5715815695  meters
min height 23.95976355858147  meters
max height 31542.48958020564  meters
min height 28.298115176148713  meters
max height 35780.72036395222  meters
min height 32.627849710173905  meters
max height 40006.99151830096  meters
min height 36.94764890149236  meters
max height 44220.03622135054  meters
min height 41.25619751494378  meters
max height 50489.064549734816  meters
min height 47.67152879666537  meters
max height 58843.38833568245  meters
min height 56.228615786880255  meters
max height 71218.4286093181  meters
min height 68.92037126235664  meters
max height 87323.4833560437  meters
min height 85.46686871536076  meters
max height 106930.95716868155  meters
min height 105.65646427776664  meters
max height 125649.4902487807  meters
min height 124.97650004737079  meters
max height 143446.80052956566  meters
min height 143.38717443030328  meters
max height 160134.12803849299  meters
min height 160.68632691167295  meters

Text(0.5, 0.98, 'Wind profile obtained from VAD')
# Author: Daniel Wolfensberger (daniel.wolfensberger@meteoswiss.ch)
# License: BSD 3 clause

import matplotlib.pyplot as plt
import numpy as np
from open_radar_data import DATASETS

import pyart

# Read in a sample file
filename = DATASETS.fetch("MLA2119412050U.nc")
radar = pyart.io.read_cfradial(filename)

# Loop on all sweeps and compute VAD
zlevels = np.arange(100, 5000, 100)  # height above radar
u_allsweeps = []
v_allsweeps = []

for idx in range(radar.nsweeps):
    radar_1sweep = radar.extract_sweeps([idx])
    vad = pyart.retrieve.vad_browning(
        radar_1sweep, "corrected_velocity", z_want=zlevels
    )
    u_allsweeps.append(vad.u_wind)
    v_allsweeps.append(vad.v_wind)

# Average U and V over all sweeps and compute magnitude and angle
u_avg = np.nanmean(np.array(u_allsweeps), axis=0)
v_avg = np.nanmean(np.array(v_allsweeps), axis=0)
orientation = np.rad2deg(np.arctan2(-u_avg, -v_avg)) % 360
speed = np.sqrt(u_avg**2 + v_avg**2)

# Display vertical profile of wind
fig, ax = plt.subplots(1, 2, sharey=True)
ax[0].plot(speed * 2, zlevels + radar.altitude["data"])
ax[1].plot(orientation, zlevels + radar.altitude["data"])
ax[0].set_xlabel("Wind speed [m/s]")
ax[1].set_xlabel("Wind direction [deg]")
ax[0].set_ylabel("Altitude [m]")
fig.suptitle("Wind profile obtained from VAD")
Total running time of the script: (0 minutes 8.406 seconds)